How does Analytics work in Incidents?
Now with Andy, you can consult and analyze the data generated by your location’s incidents through the new Analytics panel, available directly from the Incidents tool.
This panel allows you to view key indicators, download charts, and gain a clear overview of open and closed incidents, their distribution by location, and much more.
To access this panel, first log in to the Control Panel. Once inside, go to the Incidents tool. At the top, you will see it marked with the symbol “🆕 New”. Click on it to access the Analytics panel.
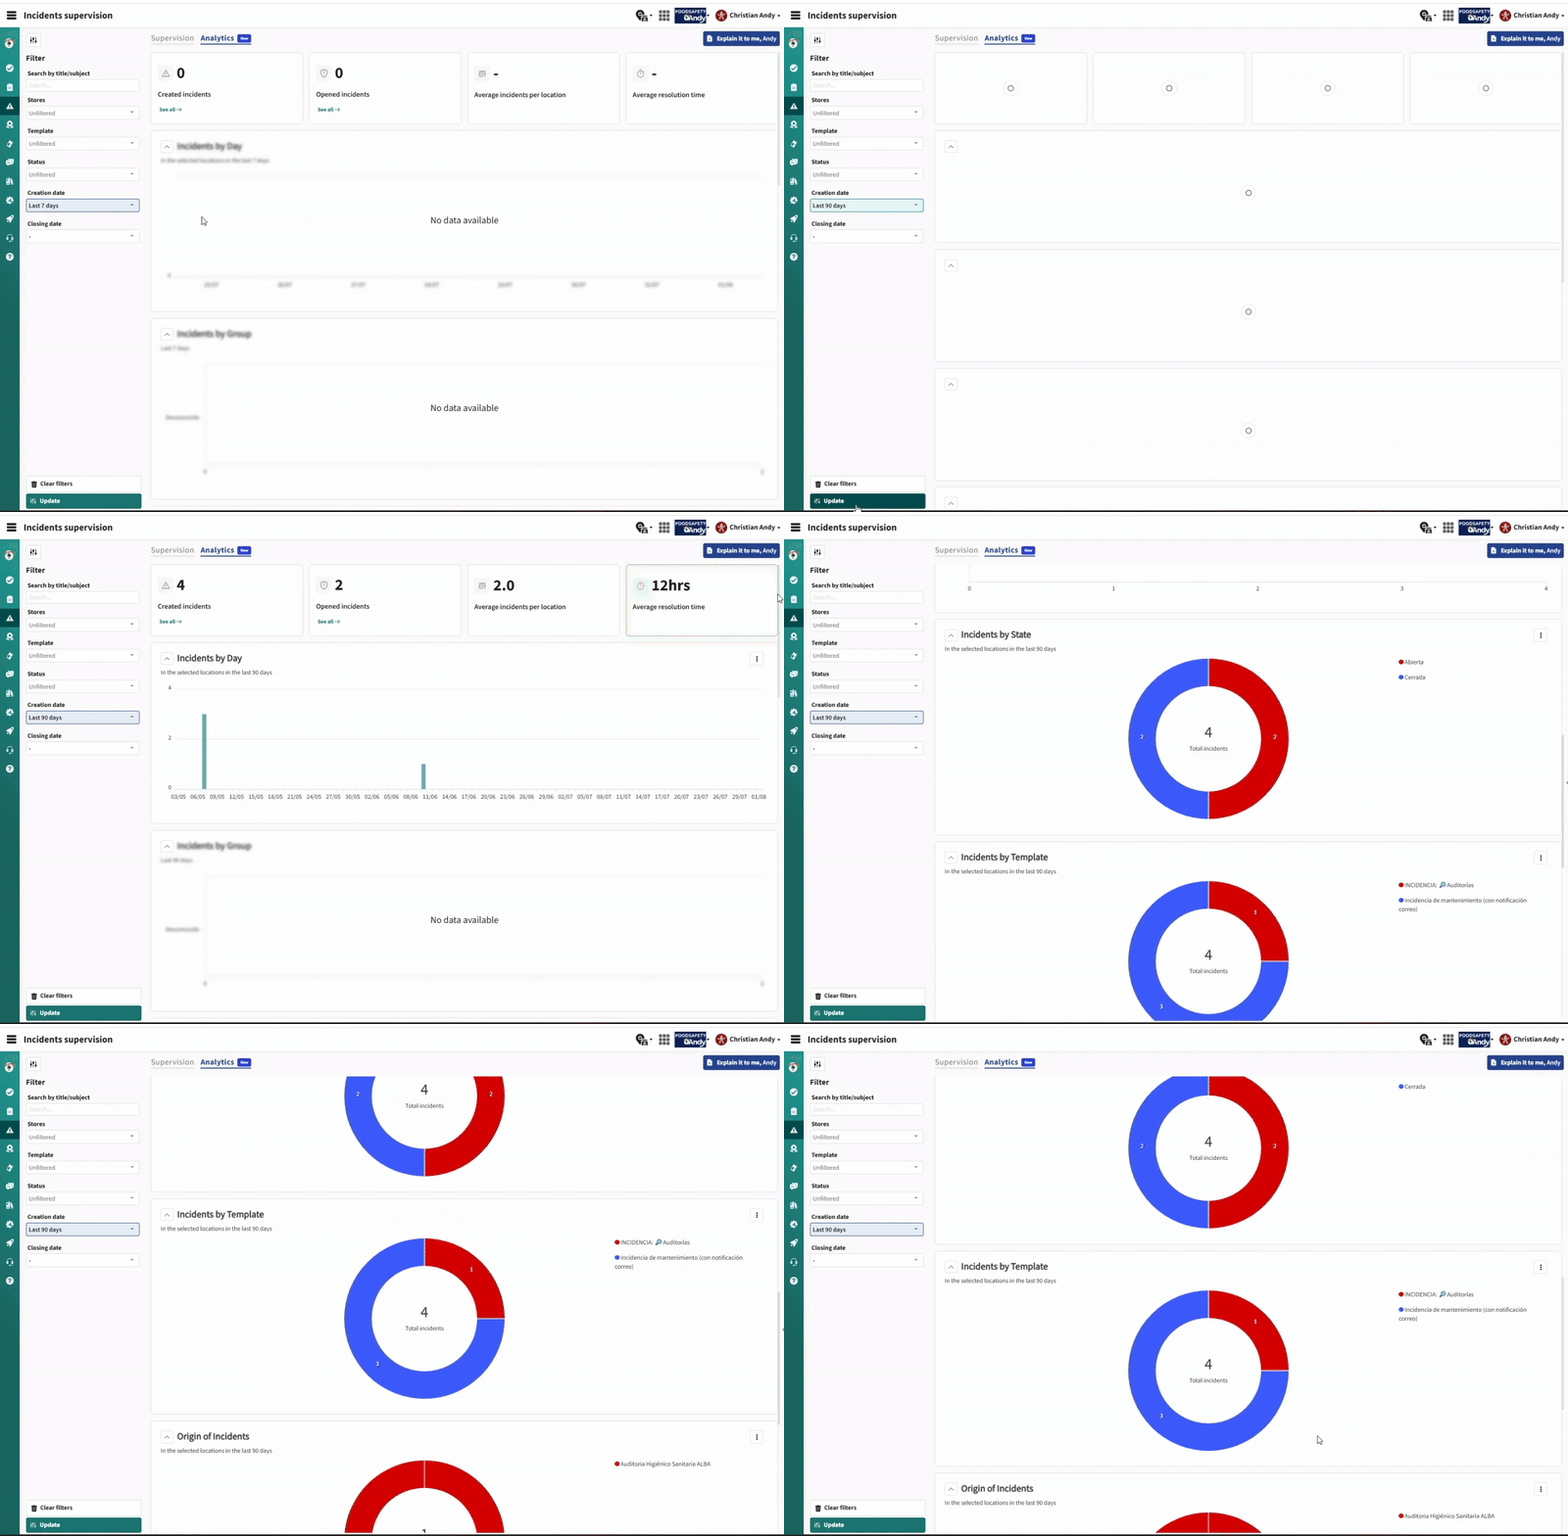
Filtering
This panel includes a set of filters that allow you to refine your search and be more precise. Filters help display the desired information in the charts:
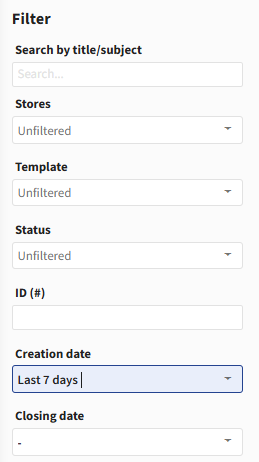
Charts
Once the appropriate filters are applied, the displayed charts include:
Incidents created within the filtered period
Incidents by group of locations
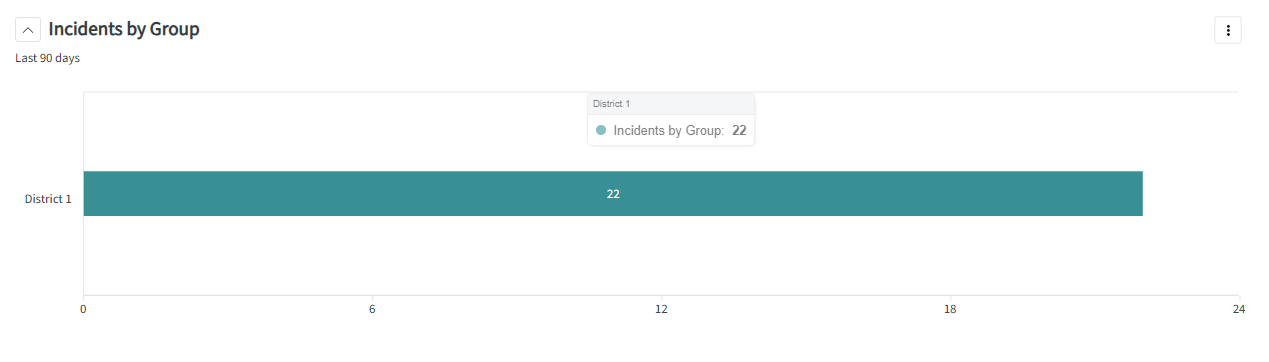
Incidents by location
Incident statuses
Incidents by template
Source of incidents
Incidents created and closed by user
Viewing incidents
Below the Incidents Created and Open Incidents charts, you will find the “View All” option.
Clicking on it opens a new detailed control panel with the complete list of incidents that match the selected filters.
From there, you can:
Clicking on it opens a new detailed control panel with the complete list of incidents that match the selected filters.
From there, you can:
Review the details of each incident
-
Sort and filter the information
-
Export the data if needed
Downloading charts
You can also download each chart in SVG, PNG, and CSV formats. To do this, click the icon in the top right corner of the chart to open the download options.